Researcher of
Electronic Measurement
Dept. of Information Engineering, University of Padova
Via Gradenigo 6/B
I-35100 Padova, Italy
Tel. +39.049.827.7961
Mail giada.giorgi@dei.unipd.it
|
|
|
Giada Giorgi Researcher of Electronic Measurement |
Ph.D. Giada Giorgi Dept. of Information Engineering, University of Padova Via Gradenigo 6/B I-35100 Padova, Italy Tel. +39.049.827.7961 Mail giada.giorgi@dei.unipd.it |
|
Quantile-Based MeasurementIntroductionIn the following a generic measurement process
characterized by a self-similar behaviour will be taken into
account. This process is defined over discrete time scales since
it usually involves a sampling operation. Our purpose is to obtain as more information as
possible about the physical phenomena under study from these measurement
data.
It should be remembered that parameter estimation from experimental data tends to become less accurate as model complexity grows, unless available data also increases accordingly by considering longer observations. This sets the terms of a tradeoff between estimation accuracy, which is important for reliable detection of parameter changes, and measurement time, that affects the capability to track data variations. Longer observation periods provide more accurate measurements but they limit the capability of tracking variations over time. On the other hand, by observing only a small number of samples, measurements would be affected by a high variability and therefore lacking in information. Most of the literature concerning data analysis is focused on the estimation of the mean or second-order statistics, like variance or autocorrelation function, of some appropriately chosen function of data measurements. It is important to note that in the case of a well-behaved time series, second order statistics are sufficient to represent the time series features. However, the observed data may be affected by occasional outliers, due to sporadic physical phenomena, that can greatly affect estimates of the arithmetic mean or the variance [see SSP 2005]. In these situations a more useful and robust statistic is provided by quantile analysis. Quantiles provide in fact additional information about the distribution of the measurements and in certain cases they may be of more interest than second-order statistics [see AMUEM 2008 ]. Time series
Let
The time series
It directly follows from this formula that the time series
Marginal probability distribution functionIn this paragraph the marginal probability distribution function of these time series will be taken into account.
Let
In the following we will consider the properties of quantiles related to
these distributions. In particular, the quantile associated to the violation probability g,
for a generic random process having marginal distribution function
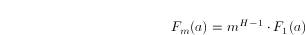
Self-Similar processesSelf-similar processes are used to model data in a great variety of engineering problems, ranging from the classical applications in hydrology to analysis of turbulent flows and, lately, of traffic computer and communication networks. In these contexts, random processes are a useful tool in the absence of a feasible physical model. If a realistic physical model is not available or cannot be determined with sufficient accuracy, then a simple stationary model is often sufficient, since it allows to assess essential quantities with reasonable accuracy. Therefore, measurement and analysis of self-similar time series represents a useful methodology for characterization and diagnosis of physical phenomena. Self-similarity is a concept, related to fractals and chaos theory, which can be associated with objects having the same geometrical, statistical or dynamical structure over different scales. In particular, a time series is self-similar when it exhibits the same statistical properties over different time scales, which can vary by many orders of magnitudes: from milliseconds to minutes and even hours; however, these properties do not hold indefinitely for real phenomena and, at some point, this structure breaks down when non-stationarity behaviors come into play. Under the assumption that the starting time series is a self-similar random process with scaling exponent H , also known as the Hurst parameter, it follows that:
The parameter H is comprised between 0.5 for an uncorrelated process and 1.0 for a completely correlated process. The Hurst parameter quantifies the asymptotic self-similar scaling as well as the degree of long-range dependence. From the relationship between marginal distribution probability functions, we obtain:
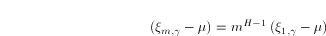
It follows that also the quantiles, associated to the same violation probability, satisfies a scaling relationship. The parameter
m represents the mean value of the time series
Therefore, by considering quantiles the attention is focused on distribution-related effects. It has been also noted that quantiles take into account the scaling properties of measurement data. Results achieved by applying this analysis to network traffic time series are reported in: VTOOLS 2006, IMTC 2006, IMTC 2007, TRANS 2007, PEVA 2008 and TRANS 2008. A generalization of the quantile analysis approach can be obtained by applying it to the time series of discrete wavelet transform (DWT) coefficients. Discrete Wavelet Transform
In the following we apply the Discrete Wavelet Transform to the time series
previously introduced. In this way, for each aggregation level, we obtain
two time series: the time series
As already known from the early pioneering studies presented in literature,
for a self-similar process a scaling relationship among wavelet coefficients
exists and has the same form for both aggregation and detail coefficients.
Therefore, by using the symbol
if the definition of aggregate process given in (1) is used. Quantile-based estimation
Let
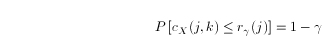
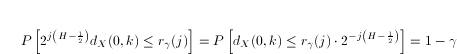
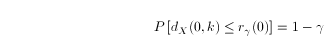
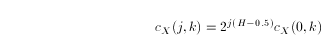
The self-similarity relationship between the wavelet coefficients extends to their quantiles. In the case of detail coefficients, where the mean value is null, the scaling relationship can be obtained in a straightforward manner by substituting equation (5) in (6). It results in:
where:
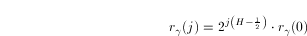
This provides the scaling expression for detail coefficients:
In general, by taking into account also the mean value, the scaling relationship between wavelet coefficients is:
Rewriting expression (10) in a log-log scale the scaling exponent can be estimated by a linear regression, as done by the Abry-Veitch estimator that is based instead on time series variances. This analysis has been also reported in: I2MTC 2009 and COST 2009. ToolIn the following you can find the Matlab code of the quantile-based estimators. Please note that the software is under the GNU general public license [see http://www.gnu.org/licenses/].
If you need help or more information, please contact me. Bibliography |
|
|
 be the time series of the measurements obtained from a given physical phenomenon.
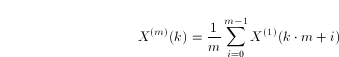
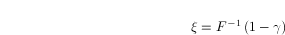
 can assume, which can be exceeded with a probability