| state | energy | state | energy | state | energy | state | energy | |||
|---|---|---|---|---|---|---|---|---|---|---|
| AT | 9.374 | EL | 7.087 | IT | 10.182 | PT | 7.254 | |||
| BA | 2.240 | ES | 8.191 | LT | 4.680 | RO | 4.430 | |||
| BE | 6.388 | 2020 | 7.672 | LU | 10.506 | RS | 2.420 | |||
| BG | 2.226 | EU28 | 8.012 | LV | 4.379 | SE | 7.821 | |||
| CY | 6.968 | FI | 5.453 | ME | 3.396 | SI | 5.494 | |||
| CZ | 3.879 | FR | 8.059 | MK | 2.853 | SK | 4.686 | |||
| DE | 8.616 | HR | 5.355 | MT | 3.826 | TR | 6.291 | |||
| DK | 14.007 | HU | 4.461 | NL | 7.400 | UK | 10.620 | |||
| EA19 | 8.230 | IE | 13.620 | NO | 11.534 | XK | 2.140 | |||
| EE | 2.806 | IS | 1.866 | PL | 4.232 | NA | ||||
| Note: | ||||||||||
| Energy productivity (gross domestic product (GDP) by the gross inland consumption of energy) in 2014 http://data.europa.eu/euodp/en/data/dataset/xWiT1fbpF5q1ZCvLQc2upg |
Introduction
Matteo Ceccarello
Yes, I see


Visualization is better at summarizing data
Consider the following summaries of a 2 dimensional dataset
- Mean 9, 7.5009091
- Standard deviation 3.3166248, 2.0315681
- Correlation coefficient 0.8164205

Visualization is better at summarizing data


https://www.nytimes.com/interactive/2019/08/29/opinion/hurricane-dorian-forecast-map.html
In this course we will study techniques
to explore and visualize data
in order to communicate with people.
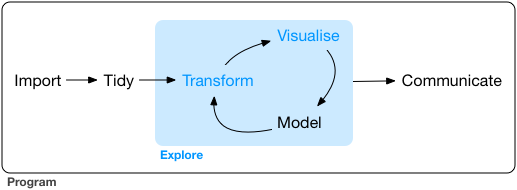
A data exploration workflow

Source: https://r4ds.had.co.nz/explore-intro.html
About me
- Matteo Ceccarello
- email: matteo.ceccarello@unipd.it
- https://www.dei.unipd.it/~ceccarello/
- Course material: https://www.dei.unipd.it/~ceccarello/DataViz

Reference material
- Data Visualization. A practical introduction. Haley.
- Fundamentals of Data Visualization. Wilke.
- R for Data Science. Wickham.
- A layered grammar of graphics. Wickham.